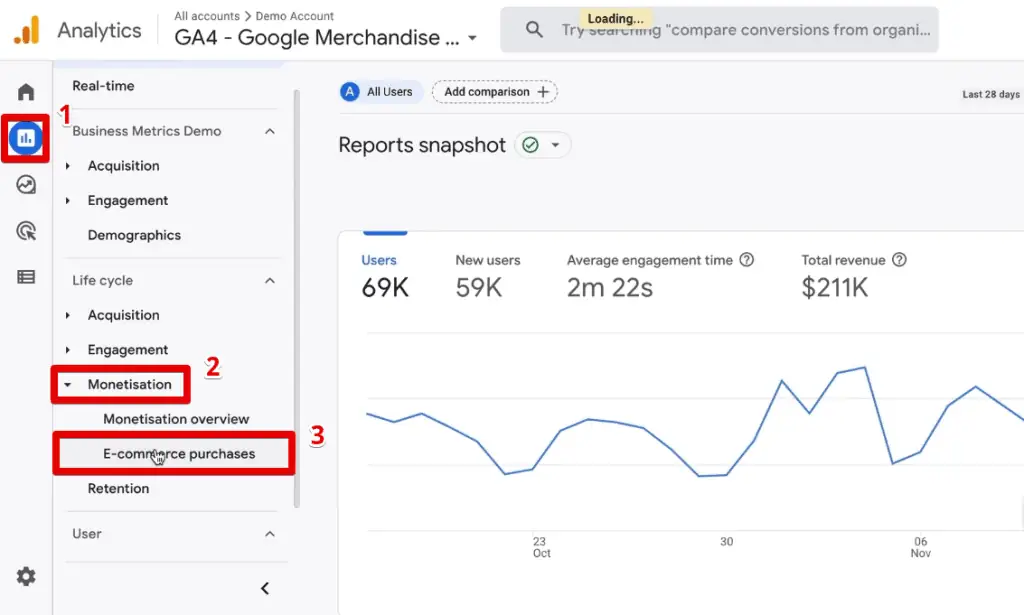
Google Analytics 4 (GA4) is a major step forward from Universal Analytics, but it doesn’t always tell you the full story about how people interact with your website.
Traditional GA4 reports are great for traffic and conversions, but when it comes to user engagement—like how far someone scrolls, what they actually see on the page, and where they lose interest—GA4 leaves important gaps.
That’s where scroll depth tracking, heatmaps, and session recordings come in. Together, they transform raw numbers into a narrative of how your users behave, what captures attention, and what sends them away.
Today, we’ll show you how to unlock scroll depth insights in GA4, pair them with tools like Hotjar and Looker Studio, and use this data to optimize both user experience and conversions.

How to Find Scroll Depth in Google Analytics GA4
Unlike Universal Analytics, GA4 doesn’t automatically provide scroll depth percentages (25%, 50%, 75%). Instead, it only fires a single scroll event when a visitor reaches 90% of the page. That’s useful—but far too limited if you want real insights.
Step 1: Enable Enhanced Measurement
- Go to Admin > Data Streams > Web > Enhanced Measurement.
- Toggle on Scrolls.
- GA4 will now log a scroll event when a user reaches 90% depth.
Step 2: Set Up Custom Scroll Depth Tracking in Google Tag Manager
If you want finer control (25%, 50%, 75%, 100%), use Google Tag Manager (GTM):
- Create a Scroll Depth Trigger in GTM.
- Choose Vertical Scroll Depths and enter thresholds (25, 50, 75, 100).
- Connect the trigger to a GA4 Event Tag and name events like scroll_25, scroll_50.
- Publish your container.

Now, GA4 will capture detailed scroll depth events, giving you insight into how much of your content visitors actually consume based on their actions.
👉 Pro Tip: Pair scroll events with the GA4 Page View event to see not just how far users scroll, but also how behavior differs between blog posts, service pages, or product pages.
Scroll Depth Google Analytics vs. Heatmaps
GA4’s scroll depth tells you how far someone scrolls—but not what they see along the way. This is where scroll depth heatmaps become essential.
- GA4 Scroll Events = numerical data (e.g., 42% of users reach 50% of the page).
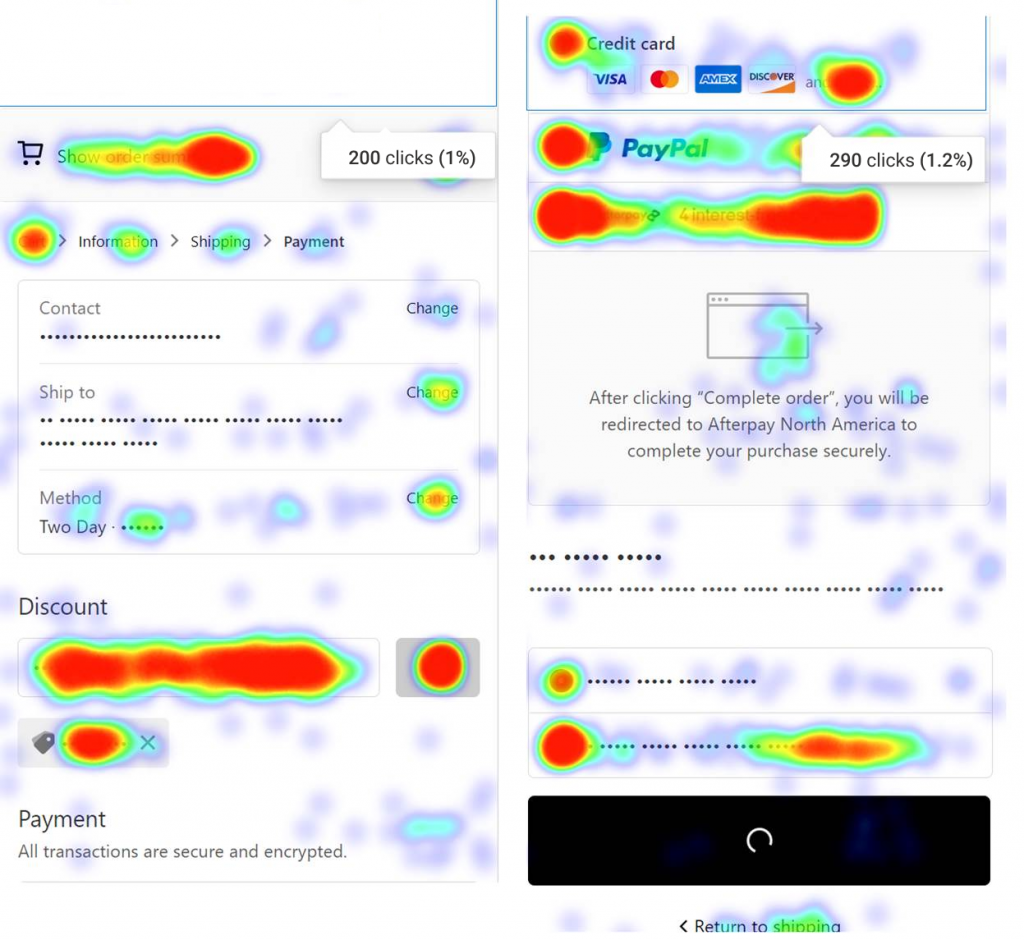
- Heatmaps = visual overlay showing where users stop scrolling, click, or hover.
Hotjar Scroll Depth
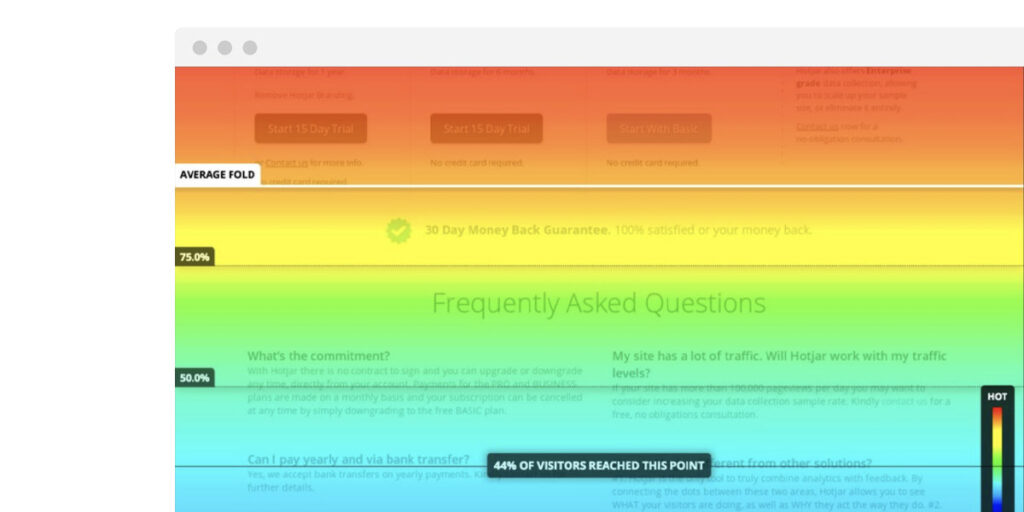
Hotjar provides a scroll depth heatmap that shows the percentage of users who reached different parts of the page. For example:
- 75% of users reached your introduction,
- 40% made it to the middle section,
- Only 15% saw your call-to-action at the bottom.
This instantly tells you if important CTAs are buried “below the fold.”

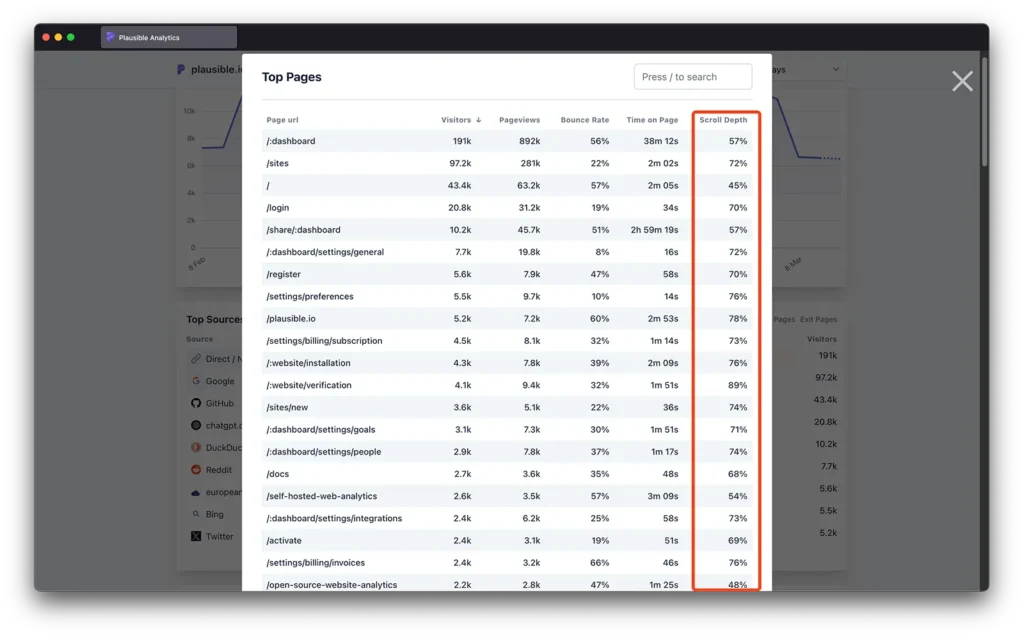
👉 Benchmark Tip: Most users only reach 50–60% of a page. If your CTA is placed at 90%, you’re missing conversions.
Scroll Tracking in GA4: How to Make It Actionable
Collecting scroll events is one thing—using them to improve your site is another. Here’s how:
- Compare by Page Type: Are users scrolling deeper on blog posts than service pages? This psychology may signal that your blog layout may be more engaging.
- Set Conversion Correlations: Do users who reach 75% of a page convert more often? If yes, encourage deeper scrolling with teasers or sticky CTAs.
- Spot Drop-Off Patterns: If a large portion exits before 25%, your headline or hero section needs work.
Reporting Scroll Depth in Looker Studio
Raw GA4 event data isn’t always digestible. That’s where Looker Studio (formerly Data Studio) shines:
- Build a scroll depth report blending Page Views with custom scroll events.
- Break down scroll behavior by traffic source, device type, or landing page.
- Create visual funnels to show how many users move from 25% → 50% → 75% → 100%.
This makes it much easier to communicate user behavior to stakeholders in a clear, visual way.

How to Create Events in GA4 (Without GTM)
Don’t want to use GTM? You can still create custom events in GA4:
- Go to Admin > Events > Create Event.
- Select the scroll event as your base.
- Add conditions (e.g., percent_scrolled = 50).
- Save and test.
For critical engagement points, mark them as Conversions—for example, reaching 75% of a landing page might signal strong purchase intent.
Heatmaps & Session Recordings: Filling the Gaps
Scroll depth shows where users stop. Heatmaps show what they see. But session recordings reveal why they stop.
- Heatmaps: Visualize aggregate behavior across thousands of users.
- Session Recordings: Replay actual user sessions to spot various cognitive biases including confusion, rage clicks, or abandoned forms.
This trio—scroll depth (quantitative), heatmaps (visual), and recordings (qualitative)—creates a full engagement story that GA4 alone cannot provide.

Beyond Scroll Depth: Connecting Engagement to Revenue
To make scroll depth insights matter, tie them back to business outcomes:
- ARPPU in GA4 (Average Revenue Per Paying User): Does deeper scrolling correlate with higher ARPPU?
- GA4 Site Search: Are users who don’t find what they want scrolling endlessly before searching? Is there certain decision fatigue?
- Scroll Depth + Conversion Rates: Do users who hit 75% of the page convert at higher rates than those who only hit 25%?
When scroll depth is connected to revenue metrics, it stops being just an engagement number and starts driving strategy.
Scroll Depth Tracking Best Practices
- Don’t Track Just 90%: That default GA4 scroll event is too limiting.
- Set 4–5 Thresholds: (25, 50, 75, 100) for granular insights.
- Benchmark Your Pages: Expect ~50–60% average depth. Anything lower suggests poor engagement.
- Align with CTAs: Ensure your key conversions are placed above your average drop-off point.
- Visualize in Looker Studio: GA4 tables alone don’t tell the story.
The Bottom Line
GA4 is a powerful analytics tool, but it isn’t built to capture scroll depth heatmaps, session replays, or in-depth engagement insights on its own. To truly understand how visitors use your site, you need a layered approach:
- GA4 Scroll Events for structured data.
- Heatmaps (Hotjar, MS Clarity, PostHog etc.) for visual insights.
- Session Recordings (MS Clarity) for qualitative behavior.
- Looker Studio for executive-level reporting.
- Revenue Metrics (ARPPU, conversions) to connect engagement with business outcomes.
👉 The real question isn’t “how far do users scroll?” It’s “how can we design content and pages so they don’t stop scrolling until they convert?”
Sometimes, you can’t rely on yourself or your in-house team to answer it. At Wavesy, we can make many of these things simple for you – so that you focus on the things that matter most. Just book an introductory call with our team to meet us and see how you can make the most out of your scroll analytics.

